


- Accueil
- Volume 29 (2025)
- Numéro 2
- Monitoring meteorological drought by different drought indices (SPI, RDI, and DI) using drought indices calculator (DrinC) – A case study from Isparta district, a semi-arid Mediterranean region in Türkiye


Visualisation(s): 987 (16 ULiège)
Téléchargement(s): 169 (10 ULiège)

Monitoring meteorological drought by different drought indices (SPI, RDI, and DI) using drought indices calculator (DrinC) – A case study from Isparta district, a semi-arid Mediterranean region in Türkiye

Document(s) associé(s)
Version PDF originaleRésumé
Surveillance de la sècheresse par différents indices de sècheresse (SPI, RDI et DI) à l'aide du calculateur d'indices de sècheresse (DrinC) : une étude de cas du district d'Isparta, une région méditerranéenne semi-aride en Turquie
Description du sujet. Les indices de sècheresse sont des outils essentiels pour surveiller la sècheresse car ils simplifient les fonctions climatiques complexes et peuvent quantifier la variance climatique en termes de gravité, de durée et de fréquence. Le logiciel de calcul d'indice de sècheresse (DrinC) est un outil utile pour surveiller la sècheresse météorologique en calculant les indices de sècheresse.
Objectifs. L'objectif principal de cette étude est d'utiliser certains indices de sècheresse tels que SPI, RDI et RD pour surveiller la gravité de la sècheresse dans une région méditerranéenne de Turquie, la province de Isparta, à l'aide du logiciel DrinC.
Méthode. Le travail de recherche a pris en compte la période de 1960 à 2021 afin de calculer les indices tels que l'indice de précipitation standardisé (SPI), l'indice de sècheresse de reconnaissance (RDI) et les déciles de précipitations (RD). Le logiciel Drought Index Calculator (DrinC) a été utilisé pour faciliter les calculs des indices pris en considération dans l'étude et qui est notamment basé sur la méthode gamma à 3, 6, 9 et 12 mois.
Résultats. Les résultats ont révélé que les années 1984, 1999 et 2015 ont enregistré des valeurs SPI-3 de -1,51, -2,11 et -2,03, respectivement. De plus, les années 1989 et 1999 ont présenté des valeurs SPI de -1,62 et -2,26, respectivement. Pour le SPI-9, les années 1999 et 2007 ont montré des valeurs de -1,66 et -1,51, respectivement. En outre, des valeurs SPI de -1,51, -1,68 et -1,94 ont été observées en 1988, 1989 et 1999, respectivement. Les résultats de la méthode des déciles de pluie ont montré que, sur 61 années, 12 années ont été affectées par la sècheresse (pourcentage le plus bas, 20 bien en dessous de la normale) et les années les plus touchées ont été 1972-1973, 1988-1989, 1989-1990, 1992-1993, 1999-2000 et 2007-2008. La valeur R2 de 0,95 a montré que le SPI annuel et le RDI annuel étaient fortement corrélés et que la régression linéaire s'ajustait bien.
Conclusions. Cette étude met en évidence l'efficacité de l'utilisation d’indices tels que le SPI, le RDI et le RD pour évaluer la sècheresse météorologique à Isparta sur une période de 60 ans. Les résultats montrent une variation de la gravité et de la fréquence des sècheresses selon les indices, le SPI identifiant davantage de sècheresses extrêmes. Les fortes corrélations entre le SPI et le RDI confirment leur fiabilité, tandis que le test de Pettitt indique un point de rupture majeur en 1970. Les conclusions soulignent l'importance d'approches multi-indices et l'intégration de mesures supplémentaires, telles que l'humidité du sol, pour améliorer la surveillance et la gestion des sècheresses.
Abstract
Description of the subject. Drought indices are essential for monitoring drought since they simplify the complex climate functions and quantify climatic variance for their severity, duration, and frequency. The drought index calculator (DrinC) software is useful for monitoring the meteorological drought by calculating drought indices.
Objectives. The main objective of this study is to use some drought indices such as SPI, RDI, and RD to monitor the severity of drought in a Mediterranean region of Türkiye, the province of Isparta, using DrinC Software.
Method. The research work considered the period from 1960 to 2021 in order to calculate the indices such as standardized precipitation index (SPI), reconnaissance drought index (RDI), and rainfall deciles (RD). The software was used to facilitate the calculation of the indices considered in the study, which are specifically based on the gamma method over 3, 6, 9, and 12 months.
Results. The results revealed that the years 1984, 1999, and 2015 recorded SPI-3 values of -1.51, -2.11, and -2.03, respectively. Additionally, the years 1989 and 1999 exhibited SPI values of -1.62 and -2.26, respectively. For SPI-9, the years 1999 and 2007 showed values of -1.66 and -1.51, respectively. Moreover, SPI values of -1.51, -1.68, and -1.94 were noted in the years 1988, 1989, and 1999, respectively. Results for the Rainfall Deciles method showed that, among 61 years, 12 years were affected by drought (lowest %20 much below normal), and the most affected years were 1972-1973, 1988-1989, 1989-1990, 1992-1993, 1999-2000, and 2007-2008. The R2 value of 0.95 showed that annual SPI and annual RDI were highly correlated, and the linear regression fit well.
Conclusions. This study highlights the effectiveness of using indices such as SPI, RDI, and RD, for assessing meteorological drought in Isparta over 60 years. Results show varying drought severity and frequency across indices, with SPI identifying more extreme droughts. Strong correlations between SPI and RDI confirm their reliability, while the Pettitt test indicates a major breakpoint in 1970. The findings emphasize the need for multi-index approaches and integrating additional measures like soil moisture to improve drought monitoring and management strategies.
Table des matières
Received 6 December 2023, accepted 25 February 2025, available online 23 April 2025.
This article is distributed under the terms and conditions of the CC-BY License (http://creativecommons.org/licenses/by/4.0)
1. Introduction
1A drought is a natural event that occurs when the amount of precipitation is significantly less than normal. It is one of the most important natural disasters that causes severe damage to the ecosystems, agricultural productions, water resources, humans and wildlife, as well as local economies (Wilhite & Glantz, 1985; Vangelis et al., 2013; Yavari et al., 2014; Zahou & Zhang, 2014; Zarei et al., 2019). Generally, droughts can be categorized into four types: hydrological, meteorological, agricultural, and socio-economic (Zarch et al., 2015; An et al., 2022). Hydrological drought, which is related to the effect of precipitation periods, is usually characterized by water loss over time from underground and surface supplies (Van Loon, 2015; Ma et al., 2016). A meteorological drought can be defined as the need for water due to insufficient precipitation (Mishra & Singh, 2010). Agricultural drought, however, is described as a situation that occurs before a hydrological drought and after a meteorological drought, where there is inadequate moisture in the roots of plants (Wilhite & Glantz, 1985). Socio-economic drought refers to whether the water supply can meet the demand of various water-use sectors and their economic benefits (Zseleczky & Yosef, 2014; Guo et al., 2019). Meteorological drought creates hydrological drought, and the formation of hydrological drought procreates agricultural drought, leading to socio-economic drought (Oksal & Beden, 2024). The effects of a severe or catastrophic drought may not be tangible after a few months and show its effects in the following years. Precisely assessing drought events is inevitable to minimize the risks of these destructive and catastrophic effects. The basic issue here is how to address an accurate assessment of the drought phenomenon. Therefore, to measure the severity of drought, this phenomenon must be converted from a qualitative and descriptive form to a quantitative and numeric form. For this purpose, drought indices are used (Heim, 2002). Drought indices are essential for monitoring drought since they simplify the complex climate functions and quantify climatic variance for their severity, duration, and frequency. Besides, these indices are also very useful for making a precise relationship between many climate parameters (Tigkas et al., 2014). The information obtained from these drought indices can be useful for planners, designers, and managers of water resources (Hayes, 2004). The review of drought studies showed that many research have been conducted to monitor meteorological droughts by using drought indices such as the Standardized Precipitation Index (SPI) and Reconnaissance Drought Index (RDI) throughout the world as well as Rainfall Deciles (RD) (Hayes et al., 1999; Anctil et al., 2002; Min et al., 2003; Ntale & Gan, 2003; Rouault & Richard, 2003; Livada & Assimakopoulos, 2006; Tsakiris et al., 2007a; Nalbantis & Tsakiris, 2009; Vasiliades et al., 2011; Hayet Khan et al., 2017; Ansarifard & Shamsnia, 2018). Scientific research carried out in recent years employs manual methods and software to calculate drought indices. This study used the drought index calculator (DrinC) software to monitor the meteorological drought by calculating drought indices (Tigkas et al., 2014; Surendran et al., 2017; Surendran et al., 2019). DrinC software package was developed at the Centre for the Assessment of Natural Hazards and Proactive Planning and the Laboratory of Reclamation Works and Water Resources Management of the National Technical University of Athens to provide a user-friendly tool for calculating several drought indices such as SPI, RDI, and RD (Tigkas et al., 2014). All the indices require a relatively small amount of data for their calculation. SPI and RD indices need only precipitation for the calculation, whereas the RDI index requires precipitation and potential evapotranspiration (PET). DrinC calculates the drought indices by considering all factors through the flexible interface and provides a simple and tangible output. However, a long-term meteorological dataset (at least 35 years) is needed for an understandable output and drought pattern. The software calculates the indices in the form of rainfall deciles (RD), stream flow Drought Index (SDI), standardized precipitation index (SPI), and reconnaissance drought index (RDI), which leads to the analysis of the drought severity for the region (Surendran et al., 2019). Furthermore, it is also possible to incorporate two other drought indices into the software, namely the Agricultural Standardised Precipitation Index (aSPI) and the Effective Reconnaissance Drought Index (eRDI), which will allow an even broader and more comprehensive drought analysis for a given region (Tigkas et al., 2022). Finally, DrinC finds its application in scientific research (Borg, 2009; Kumar & Roshni, 2021). This software can monitor drought severity along spatial distribution assessment and investigate climatic and drought conditions (Surendran et al., 2019). The frequent drought phenomena during the past two decades indicate the extreme climate events forced by global warming. Most of the studies investigating drought conditions showed an increase in drought occurrence throughout the world. Türkiye is a country where different climates can be seen as a result of both geographical location and its distinctive geographical characteristics. Moreover, it has experienced a decrease in precipitation and a considerable rise in temperature during the last few decades. Yuce & Esit (2021), during their research in the Ceyhan Basin (Türkiye), used multiple indicators to assess and compare their performances. According to previous studies (Yuce & Esit, 2021; Yildirim et al., 2022), a single indicator cannot determine the drought characteristics of a climate region. Consequently, this study employed three indicators for a comprehensive drought assessment. Therefore, the main objective of this study is to analyze and compare multiple drought indices such as SPI, RDI, and RD using the DrinC software to assess the severity, duration, and frequency of meteorological droughts in the Isparta District in Türkiye. This comparison aims to determine which indices are most effective for accurately capturing drought conditions in this region, thereby providing valuable insights for improved drought monitoring and water resource management.
2. Materials and methods
2.1. Study area and data
2Isparta is located in the North-Western Mediterranean region of Türkiye with 37˚87’N, 30˚83’E, and 1,049 m.a.s.l (Figure 1). The city area is 8,993 km2, and Burdur surrounds it in the west, Afyonkarahisar in the north, Konya in the east and Antalya in the south. Although the western part of the city is sporadically hilly, the southern part is mountainous.
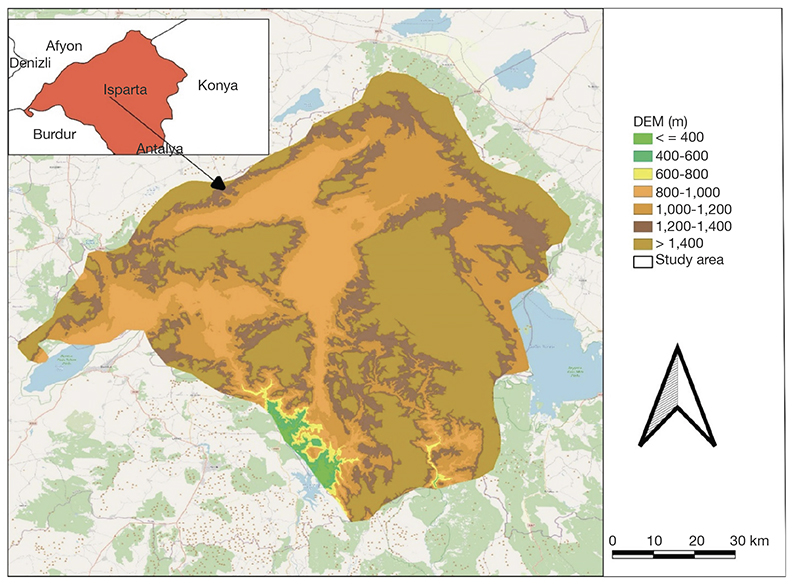
Figure 1. Map of the study area — Carte de la zone d’étude.
3The input data used for the current study are potential evapotranspiration (PET) and daily precipitation from the Isparta station (Station No: 17240). The PET was calculated using the Penman-Monteith method using Cropwat software (Cropwat 8.0). The input data needed to calculate PET in Cropwat software are daily maximum and minimum temperature (˚C), relative humidity (%), wind speed (km·day-1), and sunshine (h). Sixty-one years of meteorological datasets (1960 to 2020) obtained from the General Directory of Meteorology were used to calculate SPI values (3, 6, 9, and 12 months), RDI values (3, 6, 9, and 12 months), and RD values. The climate of Isparta city is semi-arid Mediterranean with a hot summer and very cold and snowy winter. The annual average rainfall observed during the period (1960-2020) was 532 mm. The average maximum temperature observed during the study period was 18.6 ˚C, and the minimum was 6.2 ˚C.
2.2. Drought indices
4Standardized Precipitation Index (SPI). The standardized precipitation index (SPI) is widely used in the scientific literature to characterize meteorological drought in various timescales. It was developed by McKee et al. (1993) to serve as a tool to monitor and analyze the drought severity and duration based on the long-term precipitation for the desired period in any location. The SPI is one of the most frequently used indexes in determining meteorological drought and only needs precipitation as input data. To calculate SPI, the gamma distribution is first applied to the long-term precipitation data. The gamma distribution fits well with the climatological precipitation time series, and it is defined by its frequency or probability density function:
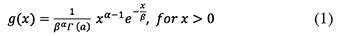
5where α and β are the shape and scale parameters respectively, x is the precipitation amount and Γ (a) is the gamma function. Parameters of the α and β of the gamma probability density function (PDF) are estimated for each station and each time scale of interest (3, 6, 9, 12 months). The maximum likelihood estimations of α and β can be as follows:
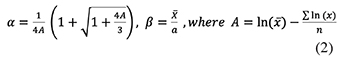
6where n is the number of observations. The resulting parameters are then used to find the cumulative probability of an observed precipitation event for the given time scale and location. Since the gamma function cannot accept zero for x and a precipitation distribution may include zeros, the cumulative probability becomes as follows:

7where q is the probability of zero precipitation and G(x) is the cumulative probability of the incomplete gamma function. If m is the number of zeros in a precipitation time series, q can be estimated by m/n. The cumulative probability H(x) is then transformed to the standard normal random variable z with mean zero and variance of one, which is the value of the SPI (Tigkas et al., 2013).
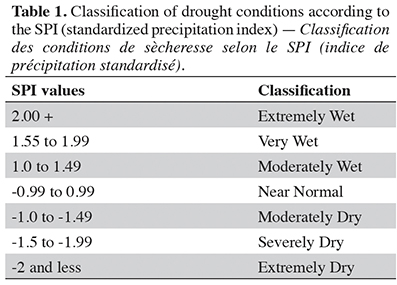
8The SPI is especially consistent and allows the comparison between different locations and climates (Ganapathi, 2018). Although the regional comparison of drought is considered a major advantage of the SPI index, noticing only rainfall as an input variable is one of its disadvantages. While positive SPI values show greater than median precipitation, negative values indicate less than median precipitation. The SPI can monitor drought on multiple time scales, which may be computed with different time steps: 3, 6, 9, and 12 months (Tigkas et al., 2014). Komuscu (1999) saw great potential in using the SPI to identify drought in the Turkish area. In addition, he considered the index to be a valuable tool for monitoring climatic conditions. Table 1 presents the classification of drought conditions according to the SPI (standardized precipitation index).
9Reconnaissance drought index (RDI). The Reconnaissance Drought Index (RDI) is one of the widely used indices due to its high resilience and sensitivity, and it can be expressed in three forms: the initial value αK, the normalized RDI (RDIn), and the standardized RDI (RDIst). In this study, we will focus on standardized RDI (RDIst). This RDI is based on the ratio between two cumulative amounts of precipitation (p) and the potential evapotranspiration of PET for a specified reference period (Al-Khafaji & Al-Ameri, 2021). The RDI was developed to approach the water deficit more accurately as a balance between input and output in a water system (Tsakiris et al., 2007b; Tigkas et al., 2014). The RDI is based on two key components: potential evapotranspiration (PET), which can be estimated using methods such as Penman-Monteith, Hargreaves or Thornthwaite, each varying in precision and data requirements, and cumulative precipitation (P), where PET is a calculated value and P is a measured variable. The initial value (αk) of RDI is calculated for the i-th year on a time basis of k (months)n as follows (Tigkas et al., 2013):
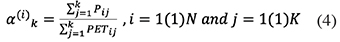
10where Pij and PETij are the precipitation and potential evapotranspiration of the j-th month of the i-th year and N is the total number of years of the available data, and K is the number of months. Under gamma and lognormal distributions, the values of αk indicated satisfactory results in various locations and different time scales (Tigkas, 2008; Tsakiris et al., 2008). By supposing that the lognormal distribution is applied, the RDIst can be calculated using the following equation:
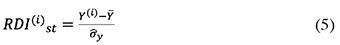
11where Y(i) is the ln (α(i)k), Y ̅ is its arithmetic mean and σ ̂y is its standard deviation. In case the gamma distribution is applied, the RDIst can be calculated by fitting the gamma probability density function (PDF) to the given frequency distribution of αk (Tigkas, 2008; Tsakiris et al., 2008; Tigkas et al., 2013). For the short reference periods (e.g. 3 months) which may include zero value for the cumulative precipitation of the period, the RDIst can be calculated based on a composite cumulative distribution function comprising the gamma cumulative probability and zero precipitation probability.
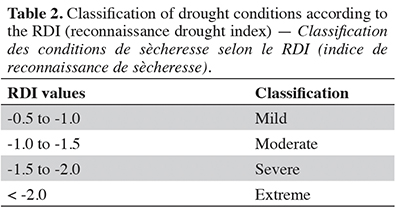
12The RDI index is calculated for a hydrological year in 3, 6, 9, and 12-month reference periods. Based on Tigkas et al. (2013), positive values of RDI indicate wet periods, while negative values indicate dry periods compared with the normal conditions of the area. The severity of drought events increases when RDI values are getting highly negative. Drought severity based on the RDI can be categorized as mild (-0.5 to -1.0), moderate (-1.0 to -1.5), severe (-1.5 to -2.0), and extreme (< -2.0), as shown in Table 2.
2.3. Rainfall deciles (RD)
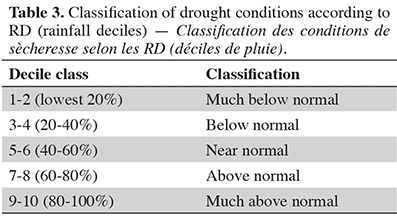
13The Rainfall Deciles method was introduced to enhance the percentage of normal precipitation. In this method, monthly precipitation totals from a long-term record are first ranked from highest to lowest to construct a cumulative frequency distribution. The distribution is then split into ten deciles. The first decile is the precipitation value not exceeded by the lowest 10% of all precipitation values in a record, the second is between the lowest 10 and 20%, etc. Rainfall Deciles (RD) are often grouped into five classes, two deciles per class. If precipitation falls into the lowest 20% (deciles 1 and 2), it is classified as “much below normal”. Precipitation between 20 and 40% (deciles 3 and 4) is classified as “below normal”. Deciles 5 and 6 (40-60%) show “near normal” precipitation, deciles 7 and 8 (60-80%) give “above normal” precipitation, and deciles 9 and 10 (80-100%) are “much above normal” (Smakhtin & Hughes, 2007). The classification of drought conditions based on deciles is shown in table 3.
2.4. Change point detection
14Change points are abrupt variations in time series. Detection of change points helps predict time series in areas such as climate change detection. It is also requisite to monitor significant sudden shifts in hydroclimatic in the context of climate change (Xie et al., 2019; Kesgin et al., 2024). This study applied Pettitt's absolute homogeneity test to detect abrupt changes in the drought index series. The non-parametric Pettitt test does not require any assumptions, and under the null hypothesis, the test assumes that the variables are independent and identically distributed; the alternative hypothesis considers that the variables are not randomly distributed and have a significant break in their mean (Wijngaard et al., 2003).
15Pettitt test. The Pettitt test is a non-parametric (rank-based) test that detects a single change point in a time series (Pettitt, 1979). This test is based on the Man-Whitney two-sample test, and since it is related to the rank order of a variable, it is unaffected by its distribution. In this test ri represents the rank of a variable, and the test statistics Xk is calculated as follows:

16The statistical test reaches its absolute maximum in the year K = E, which corresponds to the point where the structural break occurs (Kesgin et al., 2024).

17This value is compared with the critical value defined depending on the series length and significance level (Pettitt, 1979).
3. Results
3.1. Drought analysis based on SPI
18The SPI index was calculated for 3-, 6-, 9-, and 12-month time scales, with results summarized in table 4. Under the SPI-3 index, extreme drought conditions were detected in two years (1999 and 2015); severe drought affected only one year (1984), while ten years were moderately dry. No occurrence of dryness was observed for the remaining 48 years, and the very wet years (SPI >2.0) were 1962, 1966, 1969, 1979, and 2001, as it can be seen in table 4.
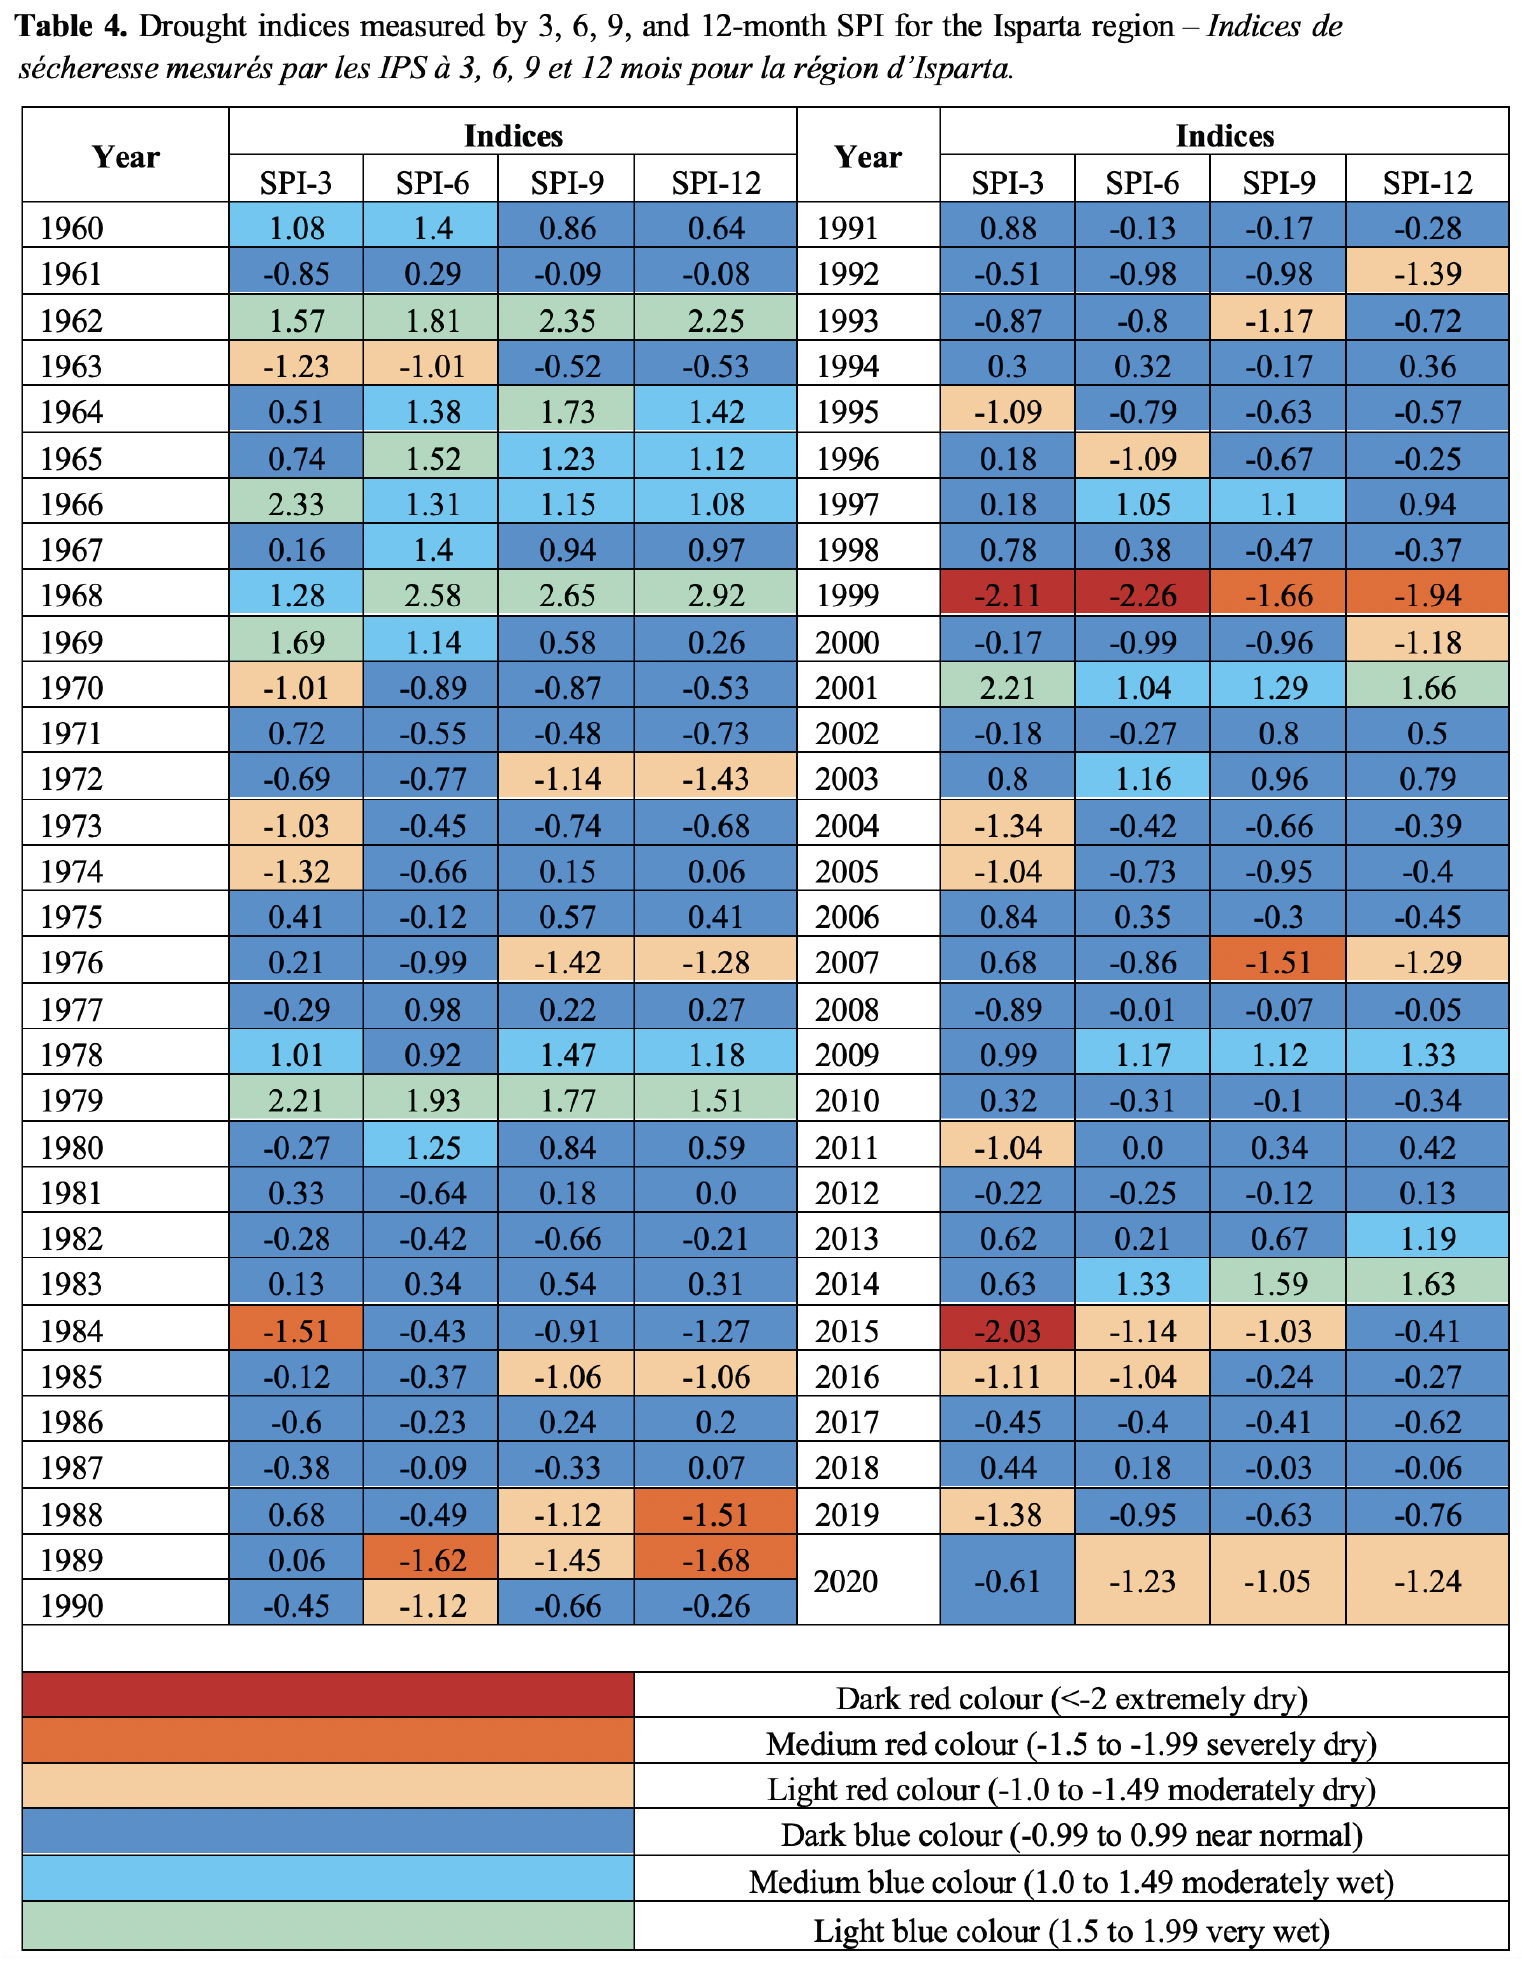
19Considering longer periods, the SPI-6 analysis confirmed the extremely dry conditions of 1999 and highlighted severe drought in 1989 and moderate drought in six years, two already identified by SPI-3 (1963 and 2016). At the longest temporal scales (under SPI-9 and SPI-12), no extreme dry years were detected, but the analysis confirmed that 1999 was the worse year (in severe drought at both 9- and 12-month time scales) followed by 1989 (again in severe drought at a 12-month time scale). Long-term severe drought was also found in 1988 (SPI-12) and 2007 (SPI-9). Moderately dry conditions were found both at 9- and 12-months in four years (1972, 1976, 1985, and 2020) and only at 9-month or 12-month scales in three and four years, respectively. On the other hand, extremely wet conditions were found for 1968, at 6-, 9- and 12- month time scales, while 1962 and 1979 were found to be severely or extremely wet at all time scales. These results show that extreme drought conditions across the analyzed period were generally associated with medium/short-term periods (3-6- months scales).
20A study analyzing SPI values from 1967 to 2017 across the entire Mediterranean catchment found that four weather stations (Pamuk, Efrenk, Lamas, and Karahacılı) recorded drought years exceeding 50%, while three additional stations (Gördürüp, Kravga, and Hamam) approached 50% on a 3-month timescale (Bayer Altin & Altin, 2021). In this current study, the percentages of drought years under the 3-, 6-, 9-, and 12-month SPI were 22%, 15%, 17%, and 17%, respectively. Furthermore, a 2005 analysis indicated that Türkiye’s southeastern and eastern parts experienced moderate droughts on shorter time scales. In contrast, the coastal regions faced drought only over more extended periods and at moderate levels (Sönmez et al., 2005).
3.2. Drought analysis based on RDI
21This study calculated a standardized Rainfall Drought Index (RDIst) for the Isparta region at 3, 6, 9, and 12-month intervals. The results for these time scales are summarized in table 5. Under RDI-3, the most affected years were 2015 (extremely dry), 1974, and 1999 (severely dry), while nine years were found to be moderately dry (Table 5). At longer time scales, no extremely dry years were observed during the study period.
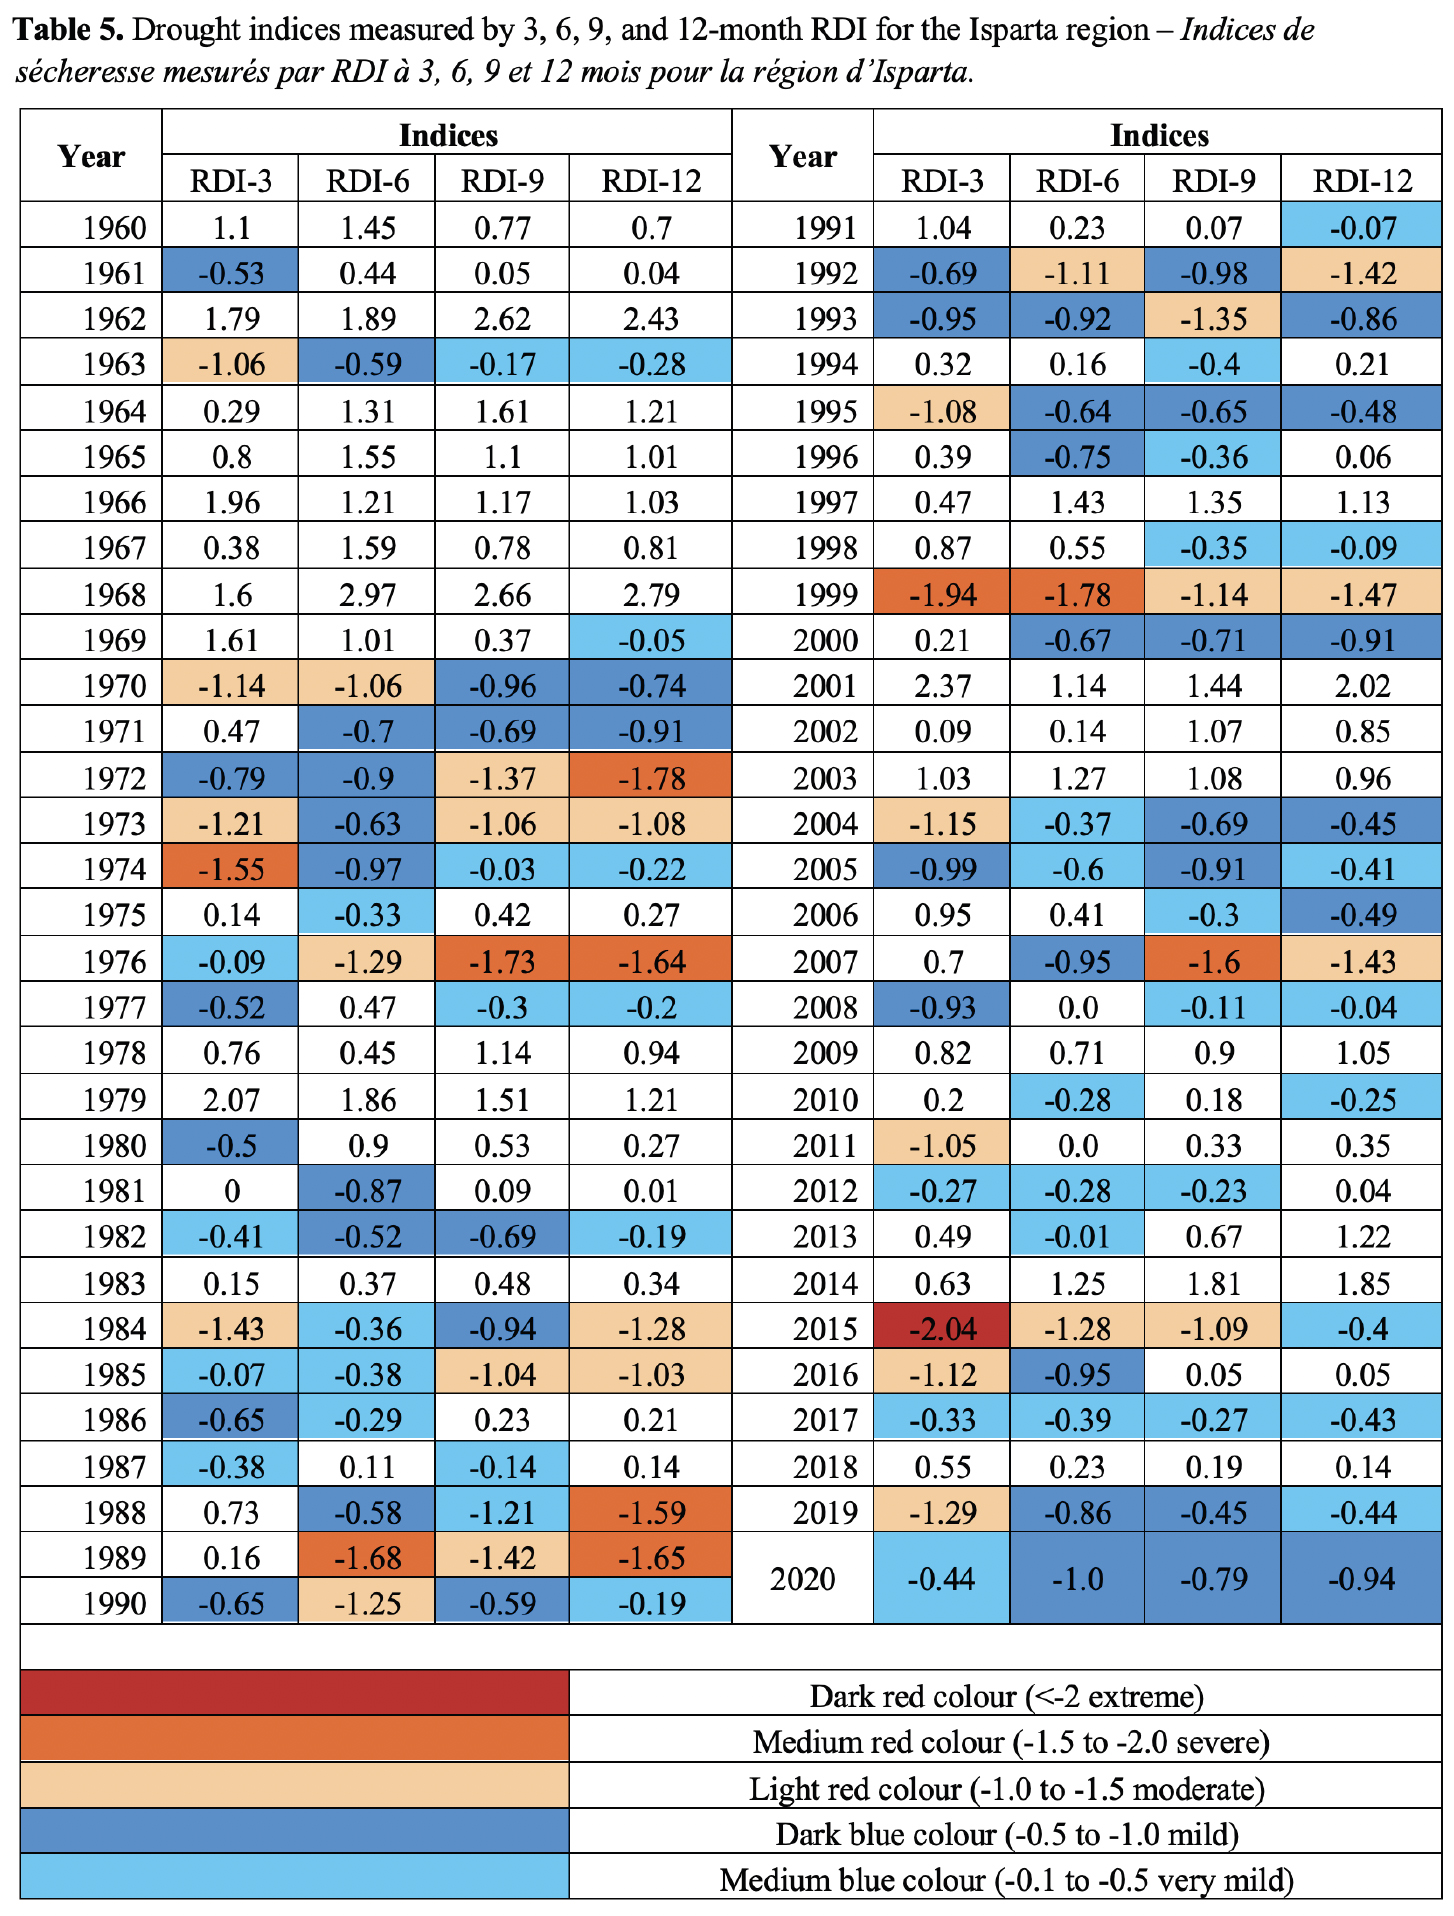
22The RDI-6 results showed one severe dry year (1999) and six moderate dry years. The RDI-9 results highlighted one severely dry year (1976) and ten moderately dry years. In contrast, there were ten moderately dry years (Table 5). The RDI-12 results detected four severely and five moderately dry years. However, no extremely dry year was observed during the study period (1960-2020).
23According to Tigkas et al. (2013), negative values of the RDI indicate dry periods compared to the area's normal conditions. They categorized drought severity as mild (-0.5 to -1.0), moderate (-1.0 to -1.5), severe (-1.5 to -2.0), and extreme (< -2.0). Therefore, mild droughts were also considered, which affected 10, 16, 12 and 8 years according to RDI-3, RDI-6, RDI-9 and RDI-12, respectively. These results confirm what has already been observed for the SPI indices: extreme drought conditions across the analyzed period were generally associated with medium/short-term periods (3-6- months scales).
3.3. Drought analysis under RD
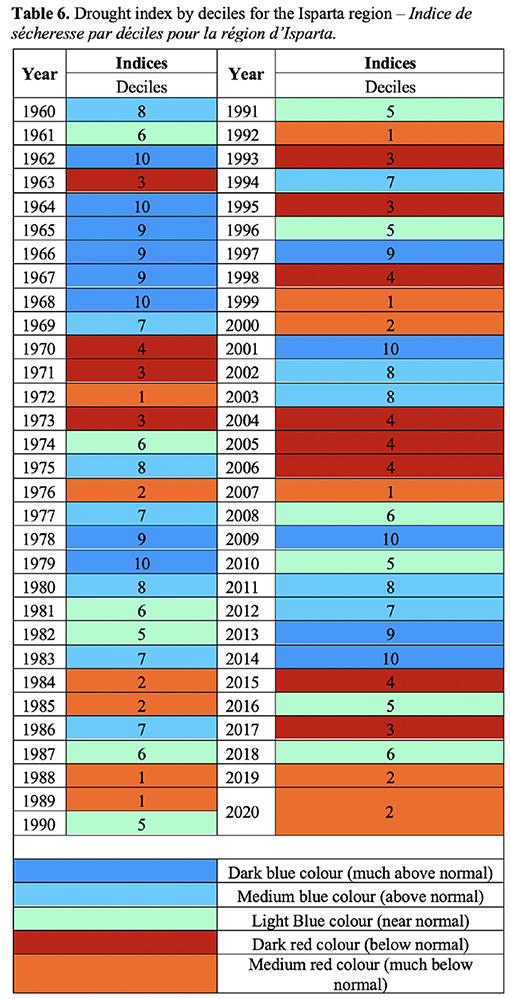
24The results of the Drought Index for the Isparta district, calculated using the Rainfall Deciles (RD) method over 60 years (1960-2020), are summarized in table 6. The analysis revealed that 12 years out of the total 60 were classified as experiencing drought, defined as the lowest 20% of precipitation (deciles 1 and 2), indicating conditions much below normal. Six years were identified as the most significantly affected (Table 6). These findings suggest that drought occurrences in the Isparta region did not follow a consistent pattern but rather exhibited significant fluctuations over the years. Furthermore, the analysis identified 10 years as very wet, categorized in deciles 9 and 10 (much above normal). This indicates that the region received much more abundant precipitation than any other year. Results from table 6 also noted that extreme drought (lowest 20% precipitation) occurred each decade from 1970 to 2020 in specific years, i.e., 1972, 1988, 1989, 1992, 1999, and 2007. The results indicated that drought occurrence does not follow any specific pattern based on RD, which is in contrast to the findings of Surendran et al. (2017). They found that the drought is cyclic and occurs almost every 3 to 7 years once repeatedly.
3.4. Drought analysis under SPI and RDI
25Figure 2 illustrates the close alignment between SPI and RDI at various time scales (3, 6, 9, and 12 months), with generally overlapping patterns and identical trend signs, indicating consistent drought identification. Notably, minor intensity discrepancies, such as in 2005 on the 3-month scale (with SPI and RDI values of -1.04 and -0.99, respectively), arise primarily from small deviations around classification thresholds. More substantial differences come out when evapotranspiration intensifies drought (due to high temperatures and low humidity) or mitigates it (under cooler, more humid conditions). Indices incorporating evapotranspiration, like RDI, are generally more responsive to these critical variations, potentially enhancing drought intensity detection.
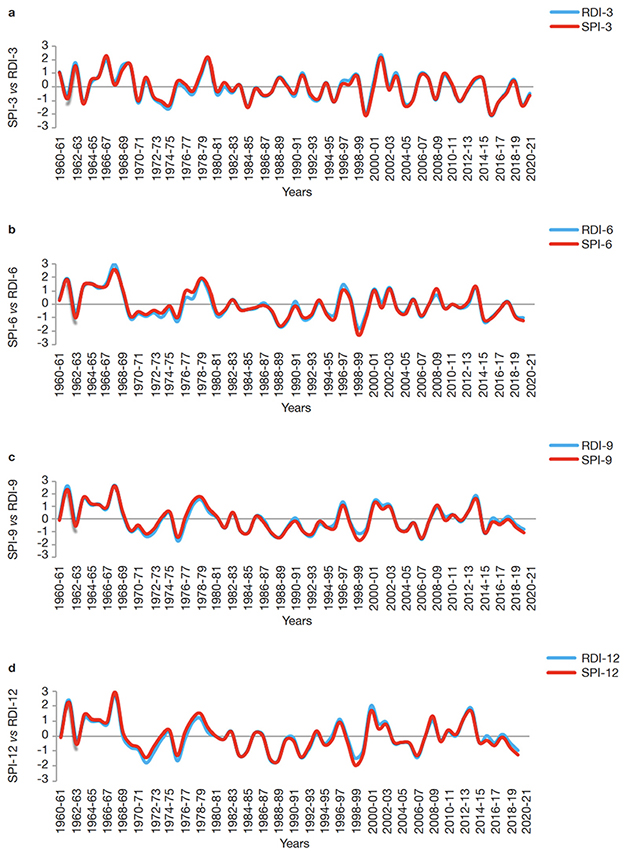
Figure 2. a. Comparison of SPI-3 and RDI-3 — Comparaison de SPI-3 et RDI-3; b. SPI-6 and RDI-6 — SPI-6 et RDI-6; c. SPI-9 et RDI-9; c. SPI-9 and RDI-9 — SPI-9 et RDI-9; d. SPI -12and RDI-12 in Isparta region — SPI-12 et RDI-12 dans la région d’Isparta.
3.5. Correlation between SPI and RDI
26The meteorological drought of 3, 6, 9, and 12 months of SPI and RDI indices were calculated, and the scatter plot of the SPI index versus the RDI index is shown in figure 3a-d. It is evident that the two indices are very well correlated in the different time scales (3, 6, 9, and 12 months), and the highest correlation was between SPI-3 and RDI-3 with R2 value of 0.97. These results align with Haied et al. (2017) who found that SPI and RDI indices correlated very well in the different time scales (1, 3, 6, 9, and 12 months).
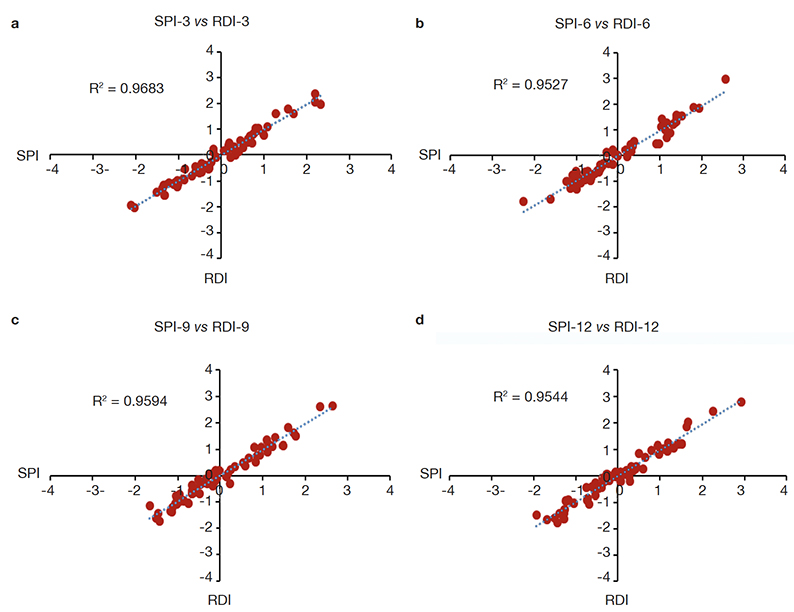
Figure 3. a. SPI-3 vs RDI-3 comparison — comparaison de SPI-3 vs RDI-3; b. SPI-6 vs RDI-6 comparison — comparaison de SPI-6 vs RDI-6; c. SPI-9 vs RDI-9 comparison — comparaison de SPI-9 vs RDI-9; d. SPI-12 vs RDI-12 comparison — comparaison de SPI-12 vs RDI-12.
3.6. Change point detection results
27This study used the Pettitt test to define sudden changes in drought indices (SPI and RDI) calculated on 3, 6, 9, and 12-month time scales from 1960 to 2020. The results of the test are summarized in table 7. According to the results obtained from the Pettitt test, 100% of the possible breaks were statistically significant at the 5% significance level. All breaks in both SPI and RDI indices (3, 6, 9, and 12-month time scales) were found to be significant. Interestingly, all breakpoints detected by the Pettitt test occurred in 1970 for both SPI and RDI drought indices. While under SPI-3, SPI-6, SPI-12, RDI-3 and RDI-6, the break points occurred in Feb-1970 for SPI-9, RDI-9, and RDI-12, it occurred in Sep-1970, Jul-1970, and Aug-1970, respectively. These results are in contrast with Kesgin et al (2024) who showed that the break point detected by Pettitt occurred in different years under SPI and RDI. For instance, under SPI and RDI (3, 6, and 12) and RDI-3, the breakpoints occurred in June 2008, May 2001, and December 2000, respectively. The difference between these two studies may be because of the time series of the dataset: Kesgin et al. (2024) used a time series of datasets from 1972 to 2020, and in this study, the time series was from 1960 to 2020. The results of the breakpoints detected by the Pettitt test are also demonstrated in Figure 4-7. As seen from the figures, the breaking point in 1970 is shown by the red line.
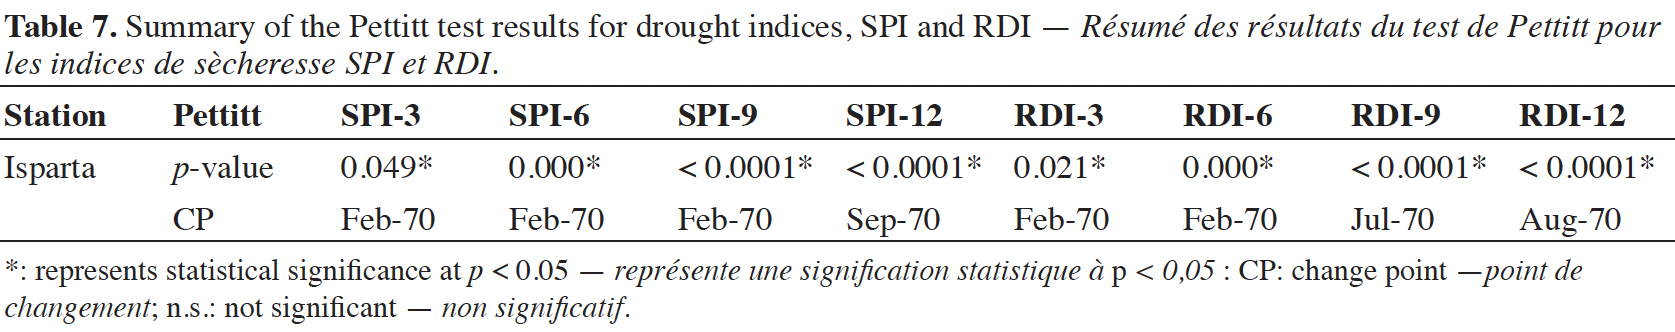
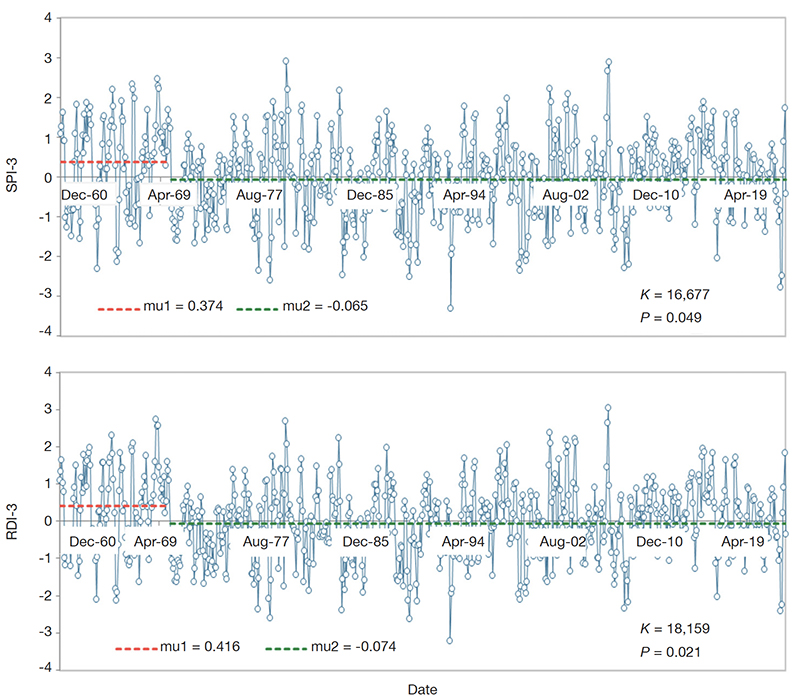
Figure 4. Pettitt test change’s change point analysis of the Isparta region’s SPI-3 and RDI-3 drought indices — Analyse des points de changement des indices de sécheresse SPI-3 et RDI-3 de la région d’Isparta par l’essai Pettitt.
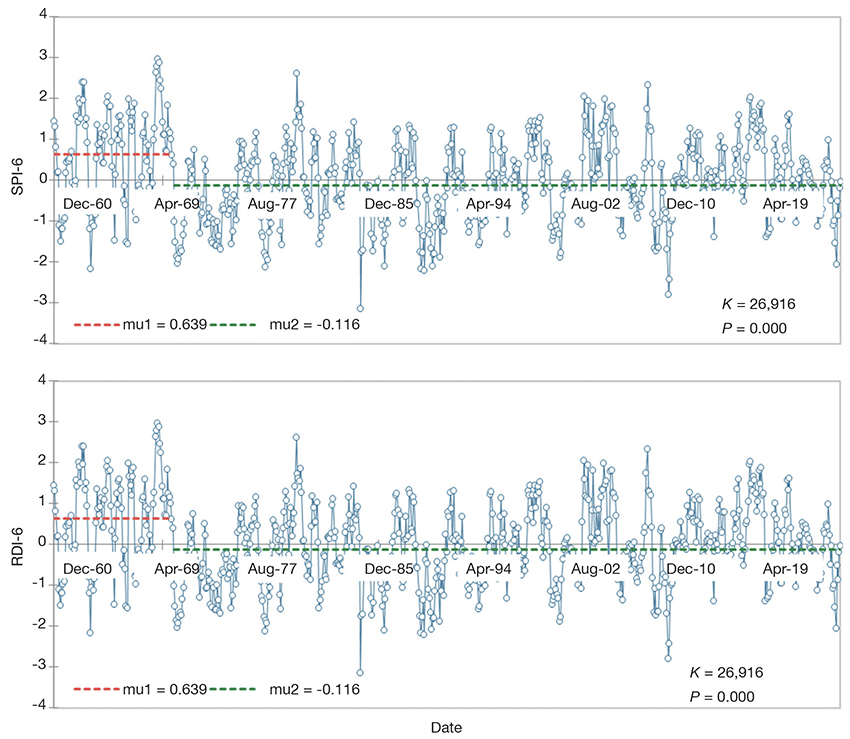
Figure 5. Pettitt test change’s change point analysis of the Isparta region’s SPI-6 and RDI-6 drought indices — Analyse des points de changement des indices de sécheresse SPI-6 et RDI-6 de la région d’Isparta par l’essai Pettitt.
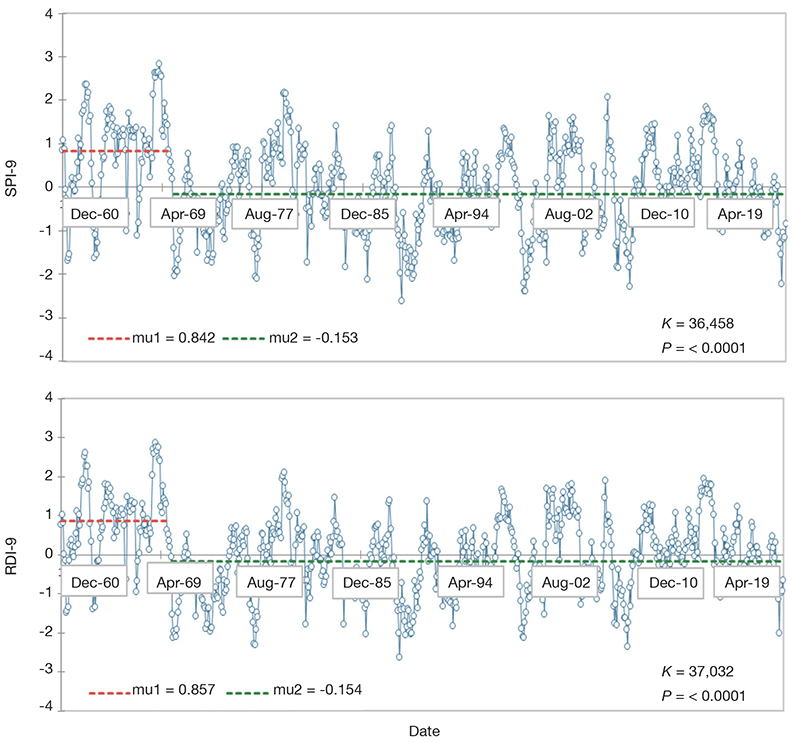
Figure 6. Pettitt test change’s change point analysis of the Isparta region’s SPI-9 and RDI-9 drought indices — Analyse des points de changement des indices de sécheresse SPI-9 et RDI-9 de la région d’Isparta par l’essai Pettitt.
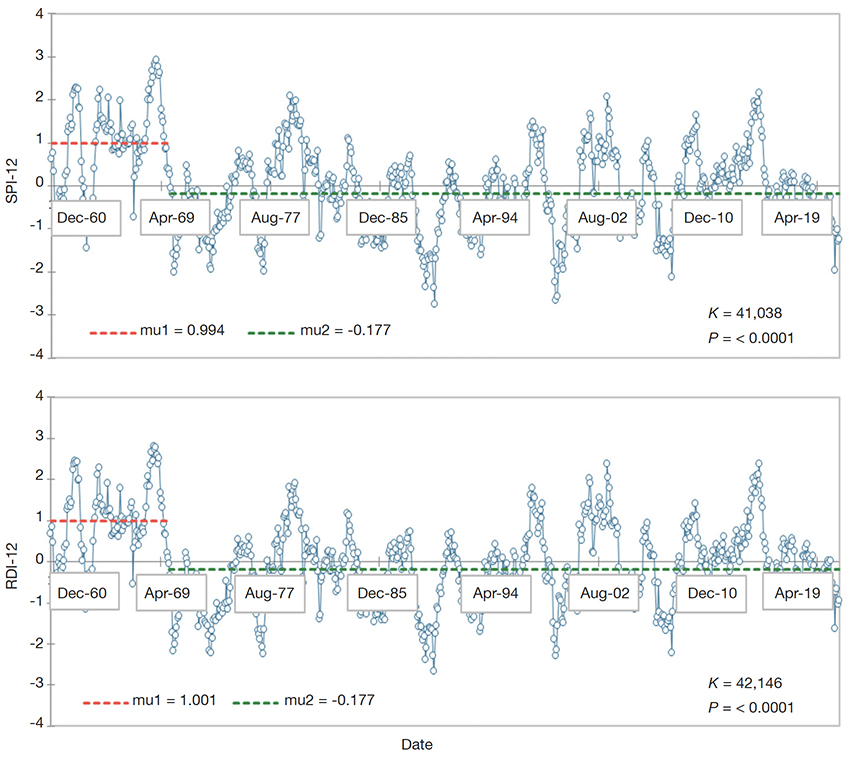
Figure 7. Pettitt test change’s change point analysis of the Isparta region’s SPI-12 and RDI-12 drought indices — Analyse des points de changement des indices de sécheresse SPI-12 et RDI-12 de la région d’Isparta par l’essai Pettitt.
4. Discussion
28This study thoroughly analyses drought patterns in the Isparta region using SPI, RDI, and RD indices across multiple time scales (3, 6, 9, and 12 months). The results highlight both short-term variability and long-term trends, offering valuable insights for drought management and climate adaptation. The results of the SPI analysis reveal significant temporal variability in drought occurrences over different time scales, highlighting the dynamic nature of drought intensity and duration. The SPI-3 and SPI-6 indices show that extreme drought conditions are more prevalent in short-to-medium-term periods, while longer-term scales (SPI-9 and SPI-12) generally show fewer extreme drought occurrences. This result aligns with Bayer Altin & Altin (2021) findings, where certain weather stations in the Mediterranean region recorded frequent short-term droughts. The year 1999 stands out as a critical drought year across multiple time scales, exhibiting extreme conditions at shorter intervals (SPI-3 and SPI-6) and severe drought at longer intervals (SPI-9 and SPI-12). Similarly, 1989 was critical in longer-term scales, suggesting prolonged dry periods. These findings support previous studies, such as Sönmez et al. (2005), which indicated that southeastern and eastern Türkiye experienced more frequent and severe short-term droughts. In contrast, coastal regions tended to face longer-term but moderate droughts. Moreover, identifying extreme wet conditions in specific years (e.g., 1962, 1968, and 1979) at multiple time scales suggests that the region also experiences significant pluvial episodes. Notably, 1968 was extremely wet across SPI-6, SPI-9, and SPI-12, indicating a prolonged wet period that might have contributed to increased groundwater recharge and hydrological stability. The RDI analysis confirms that extreme droughts in the Isparta region are mostly short- to medium-term (3–6 months), aligning with the SPI results. The most severe droughts occurred in 2015 (extreme, RDI-3) and 1999 (severe, RDI-3 and RDI-6), while moderate droughts were frequent across all time scales. The RDI-3 results highlight 2015 as extremely dry, with 1974 and 1999 experiencing severe drought conditions. Multiple moderately dry years at all time scales confirm that while extreme droughts may be rare over extended periods, moderate to severe drought conditions persist over time, potentially impacting water availability and agricultural productivity. Notably, the RDI-6 and RDI-9 indices detected fewer severe drought years, but the RDI-12 index revealed four severe drought years. The absence of extreme drought events in longer time scales suggests that while short-term droughts may be intense, the overall climatic conditions in the region allow for periodic recovery. This aligns with previous findings by Tigkas et al. (2013), where negative RDI values indicated deviation from normal rainfall conditions, with moderate to severe drought events occurring frequently. When mild droughts are included in the analysis, dry-year frequency increases significantly across all time scales, with 16 years affected at the RDI-6 level. This highlights the persistence of water deficits in the region, even if extreme droughts are infrequent at longer time scales. The similarities between the RDI and SPI results confirm the reliability of using multiple indices to understand drought characteristics comprehensively. The Rainfall Deciles analysis shows irregular drought occurrences in Isparta over 60 years, with 12 affected years and six experiencing significant drought. Unlike Surendran et al. (2017), no cyclic pattern was observed. Extreme droughts occurred sporadically (e.g., 1972, 1988, 1999, 2007), while 10 years were very wet, indicating substantial variability. These findings highlight the need for flexible water management and further research on climate drivers to improve drought predictions. The SPI and RDI indices showed a strong correlation across all time scales (3, 6, 9, and 12 months), with the highest correlation observed at SPI-3 and RDI-3 (R2 = 0.97). This aligns with Haied et al. (2017), who also found a strong relationship between these indices at multiple time scales. These results confirm the reliability of using both indices for drought assessment and highlight their consistency in detecting meteorological droughts. The Pettitt test identified statistically significant breakpoints (p < 0.05) in all SPI and RDI indices across 3-, 6-, 9-, and 12-month time scales, with all changes occurring in 1970. Breakpoints were detected in February for most indices, except SPI-9 (September), RDI-9 (July), and RDI-12 (August). These findings contrast with Kesgin et al. (2024), who found breakpoints in different years (2000–2008), likely due to differences in dataset periods (1960–2020 in this study vs 1972–2020 in theirs). The breakpoints, visualized in figures 4-7, suggest a major climatic shift in 1970, influencing drought patterns in the region.
5. Conclusions
29This study assessed meteorological drought in the Isparta region from 1960 to 2020 using the Drought Index Calculator (DrinC) to calculate Rainfall Deciles (RD), the Standardized Precipitation Index (SPI), and the Reconnaissance Drought Index (RDI). The SPI detected 25 dry years, with 19 moderate, 4 severe, and 2 extreme droughts, while RDI identified 21 dry years, including 13 moderate, 7 severe, and 1 extreme drought. The RD indicated 12 dry years, with none in the 1960s. SPI and RDI showed a strong correlation across all time scales, peaking at SPI-3 and RDI-3 (R² = 0.97). However, SPI detected more extreme droughts, especially at shorter time scales. Pettitt test results revealed a significant climatic shift in 1970, marking a common breakpoint across all SPI and RDI time scales. These findings emphasize the need for a multi-index approach to drought monitoring. Future research should incorporate additional indices such as soil moisture-based measures to improve accuracy. Applying these indices to agricultural yield prediction could enhance drought management in similar climates, contributing to more effective resilience strategies.
Acknowledgements
30We are grateful to the Turkish State Meteorological Service for providing meteorological data for this research.
Author contributions
31Conceptualization, Mohammad Agharezaee and Yusuf Ucar; methodology, Mohammad Agharezaee and Yusuf Ucar; software, Mohammad Agharezaee, Yusuf Ucar and Özlem Terzi; validation, Mohammad Agharezaee, Yusuf Ucar and Joanna Kocięcka; formal analysis, Mohammad Agharezaee and Özlem Terzi; investigation, Mohammad Agharezaee and Yusuf Ucar; data curation, Mohammad Agharezaee, Yusuf Ucar and Joanna Kocięcka; writing—original draft preparation, Mohammad Agharezaee and Joanna Kocięcka writing—review and editing, Joanna Kocięcka and Yusuf Ucar. All authors have read and agreed to the published version of the manuscript.
Bibliographie
Al-Khafaji S.M. & Al-Ameri R.A., 2021. Evaluation of drought indices correlation for drought frequency analysis of the Mosul dam watershed. IOP Conf. Ser.: Earth Environ. Sci., 779, 012077, doi.org/10.1088/1755-1315/779/1/012077
An S., Park G., Jung H. & Jang D., 2022. Assessment of future drought index using SSP scenario in Rep. of Korea. Sustainability, 14(7), 42-52, doi.org/10.3390/su14074252
Anctil F., Larouche W., Viau A.A. & Parent L.É., 2002. Exploration of the standardized precipitation index with regional analysis. Can. J. Soil Sci., 82, 115-125.
Ansarifard S. & Shamsnia D.A., 2018. Monitoring drought by Reconnaissance Drought Index (RDI) and Standardized Precipitation Index (SPI) using DrinC software. Water Util. J., 20, 29-35.
Bayer Altin T. & Altin B.N., 2021. Response of hydrological drought to meteorological drought in the eastern Mediterranean Basin of Turkey. J. Arid Land, 13, 470-486, doi.org/10.1007/s40333-021-0064-7
Borg D.S., 2009. An application of drought indices in Malta, case study. Eur. Water, 25/26, 25-38.
Ganapathi H., 2018. Assessment drought severity using standard precipitation index in Ahmednagar district, India. Int. Res. J. Eng. Technol., 5, 1777-1780.
Gibbs W.J. & Maher J.V., 1967. Rainfall deciles as drought indicators. Bulletin no. 48. Melbourne, Australia: Bureau of Meteorology.
Guo Y. et al., 2019. Assessing socioeconomic drought based on an improved multivariate standardized reliability and resilience index. J. Hydrol., 568, 904-918, doi.org/10.1016/j.jhydrol.2018.11.055
Haied N. et al., 2017. Drought assessment and monitoring using meteorological indices in a semiarid region. Energy Procedia, 119, 518-529.
Hayes M.J., Svoboda M.D., Wilhite D.A. & Varnyarkho O.V., 1999. Monitoring the 1996 drought using the Standardized Precipitation Index. Bull. Am. Meteorol. Soc., 80(3), 429-438, doi.org/10.1175/1520-0477
Hayes M., 2004. Drought indices, national drought mitigation center, http://www.drought.unl.edu/whatis/indices.html (10.08.2022).
Hayet Khan M.M., Nur Shazwani M. & El-Shafie A., 2017. Drought characterization in Peninsular Malaysia using DrinC software. Sci. Technol., 25, 81-90.
Heim R. Jr., 2002. A review of twentieth-century drought indices used in the United States. Bull. Am. Meteorol. Soc., 83, 1149-1166, doi.org/10.1175/1520-0477-83.8.1149
Kesgin E., Yaldız S.G. & Güçlü Y.S., 2024. Spatiotemporal variability and trends of droughts in the Mediterranean costal region of Türkiye. Int. J. Climatol., 44, 1036-1057, doi.org/10.1002/joc.8370
Komuscu A.U., 1999. Using the SPI to analyze spatial and temporal patterns of drought in Turkey. Drought Network News, 49, 199-201.
Kumar S. & Roshni T., 2021. Analysis of drought, its impact on land use/land cover and duration-severity analysis for the Sone River catchment, Bihar. Int. J. Hydrol. Sci. Technol., 12(3), 316-332, doi.org/10.1504/ijhst.2021.117546
Livada I. & Assimakopoulos V.D., 2006. Spatial and temporal analysis of drought in Greece using the Standardized Precipitation Index (SPI). Theor. Appl. Climatol., 89, 143-153, doi.org/10.1007/s00704-005-0227-z
Ma M. et al., 2016. Hydrologic model-based Palmer indices for drought characterization in the Yellow River basin, China. Stochastic Environ. Res. Risk Assess., 30, 1401-1420, doi.org/10.1007/s00477-015-1136-z
Mckee T.B., Doesken N.J. & Kleist J., 1993. The relationship of drought frequency and duration to time scale. In: Proceeding of the 8th Conference on applied climatology, 17-22 January 1993, Anaheim, CA, USA, 179-184.
Min S.K., Kwon W.T., Park E.H. & Choi Y., 2003. Spatial and temporal comparisons of droughts over Korea with East Asia. Int. J. Climatol., 23, 223-233, doi.org/10.1002/joc.872
Mishra A.K. & Singh V.P., 2010. A review of drought concepts. J. Hydrol., 391, 202-216, doi.org/10.1016/j.jhydrol.2010.07.012
Nalbantis I. & Tsakiris G., 2009. Assessment of hydrological drought revisited. Water Resour. Manage., 23, 881-897, doi.org/10.1007/s11269-008-9305-1
Ntale H.K. & Gan T.Y., 2003. Drought indices and their application to East Africa. Int. J. Climatol., 23, 1335-1357, doi.org/10.1002/joc.931
Oksal N.G.S. & Beden N., 2024. Drought analysis based on SPI and RDI drought indices in the Burdur basin. Turk. J. Eng., 8, 127-138, doi.org/10.31127/tuje.1326875
Pettitt A.N., 1979. A non-parametric approach to the change-point problem. J. R. Stat. Soc. C, 28(2), 126-135, doi.org/10.2307/2346729
Rouault M. & Richard Y., 2003. Intensity and spatial extension of drought in South Africa at different time scales. Water SA, 29, 489-500, doi.org/10.4314/wsa.v29i4.5057
Smakhtin V.U. & Hughes D.A., 2007. Automated estimation and analyses of meteorological drought characteristics from monthly rainfall data. Environ. Model. Softw., 22, 880-890, doi.org/10.1016/j.envsoft.2006.05.013
Sönmez F.K., Kömüscü A.Ü., Erkan A. & Turgu E., 2005. An analysis of spatial and temporal dimension of drought vulnerability in Turkey using the standardized precipitation index. Nat. Hazards, 35, 243-264, doi.org/10.1007/s11069-004-5704-7
Surendran U., Kumar V., Ramasubramoniam S. & Raja P., 2017. Development of drought indices for semi-arid region using drought indices calculator (DrinC) – a case study from Madurai District, a semi-arid region in India. Water Resour. Manage., 31, 3593-3605, doi.org/10.1007/s11269-017-1687-5
Surendran U. et al., 2019. Analysis of drought from humid, semi-arid and arid regions of India using DrinC model with different drought indices. Water Resour. Manage., 33, 1521-1540, doi.org/10.1007/s11269-019-2188-5
Tigkas D., 2008. Drought characterisation and monitoring in regions of Greece. Eur. Water, 23/24, 29-39, https://www.ewra.net/ew/pdf/EW_2008_23-24_03.pdf, (16/04/2025).
Tigkas D., Vangelis H. & Tsakiris G., 2013 The drought indices calculator (DrinC). In: Proceedings of the 8th International Conference of EWRA, 26-29 June 2012, Porto, Portugal, 1333-1342,
Tigkas D., Vangelis H. & Tsakiris G., 2014. DrinC: a software for drought analysis based on drought indices. Earth Sci. Inf., 8, 697-709, doi.org/10.1007/s12145-014-0178-y
Tigkas D., Vangelis H., Proutsos N. & Tsakiris G., 2022. Incorporating aSPI and eRDI in Drought Indices Calculator (DrinC) software for agricultural drought characterisation and monitoring. Hydrology, 9, 100, doi.org/10.3390/hydrology9060100
Tsakiris G., Pangalou D., Tigkas D. & Vangelis H., 2007a. Assessing the areal extent of drought. In: Proceedings of the Conference, Water resources management: new approaches and technologies, 14-16 June 2007, Technical University of Crete, Chania, Crete, Greece.
Tsakiris G., Pangalou D., Tigkas D. & Vangelis H., 2007b. Regional drought assessment based on the Reconnaissance Drought Index (RDI). Water Resour. Manage., 21, 821-833, doi.org/10.1007/s11269-006-9105-4
Tsakiris G. et al., 2008. Drought meteorological monitoring network design for the reconnaissance drought index (RDI). Options Méditerranéennes Ser. A, 80, 57-62.
Van Loon A.F., 2015. Hydrological drought explained. WIRES, 2, 359-392, doi.org/10.1002/wat2.1085
Vangelis H., Tigkas D. & Tsakiris G., 2013. The effect of PET method on Reconnaissance Drought Index (RDI) calculation. J. Arid. Environ., 88, 130-140, doi.org/10.1016/j.jaridenv.2012.07.020
Vasiliades L., Loukas A. & Liberis N.A., 2011. A water balance derived drought index for Pinios river basin, Greece. Water Resour. Manage., 25, 1087-1101, doi.org/10.1007/s11269-010-9665-1
Wijngaard J.B., Klein Tank A.M.G. & Könen G.P., 2003. Homogeneity of 20th century European daily temperature and precipitation series. Int. J. Climatol., 23(6), 679-692, doi.org/10.1002/joc.906
Wilhite D.A. & Glantz M.H., 1985. Understanding: the drought phenomenon: the role of definitions. Water Int., 10, 111-120, doi.org/10.1080/02508068508686328
Xie P. et al., 2019. Comparison of different methods for detecting change points in hydroclimatic time series. J. Hydrol., 577, 123973, doi.org/10.1016/j.jhydrol.2019.123973
Yavari M. et al., 2014. Evaluation of “experimental methods in estimation of large-scale actual annual evapotranspiration” using “estimated evapotranspiration from SEBAL” for Neyshabor plain. J. Irrig. Water Eng., 5, 44-55.
Yildirim G. & Rahman A., 2022. Homogeneity and trend analysis of rainfall and droughts over Southeast Australia. Nat. Hazards, 112(2), 1657-1683, doi.org/10.1007/s11069-021-05151-w
Yuce M.I. & Esit M., 2021. Drought monitoring in Ceyhan basin, Turkey. J. Appl. Water Eng. Res., 9(4), 293-314, doi.org/10.1080/23249676.2021.1932616
Zahou D. & Zhang B., 2014. Effect of potential evapotranspiration estimation method on Reconnaissance Drought Index (RDI) calculation. China J. Agrometeorol., 35, 258-267.
Zarch M.A.A., Sivakumar B. & Sharma A., 2015. Droughts in a warming climate: a global assessment of Standardized Precipitation Index (SPI) and Reconnaissance Drought Index (RDI). J. Hydrol., 526, 183-195, doi.org/10.1016/j.jhydrol.2014.09.071
Zarei A.R., Moghimi M.M. & Bahrami M., 2019. Comparison of Reconnaissance Drought Index (RDI) and Effective Reconnaissance Drought Index (ERDI) to evaluate drought severity. Sustainable Water Resour. Manage., 53, 1345-1356, doi.org/10.1007/s40899-019-00310-9
Zseleczky L. & Yosef S., 2014. Are shocks really increasing? A selective review of the global frequency, severity, scope, and impact of five types of shocks. In: Proceedings of the Conference Building resilience for food and nutrition security, May 17-19, Addis Ababa, Ethiopia. Washington, DC: International Food Policy Research Institute (IFPRI), conference paper 5.
